Andrew Okolski, Senior Financial Strategist at The Baker Group
2020 will certainly be remembered as the year COVID-19 changed the world as we know it. Likewise, the associated “Lockdown Recession” is already changing the way many banks manage their balance sheets. With loan demand dropping in most parts of the country and stimulus deposits adding to already bloated cash positions, proactive strategic planning has never been more crucial. More to the point, proper liquidity management may offer some of the additional margin and income banks desperately need.
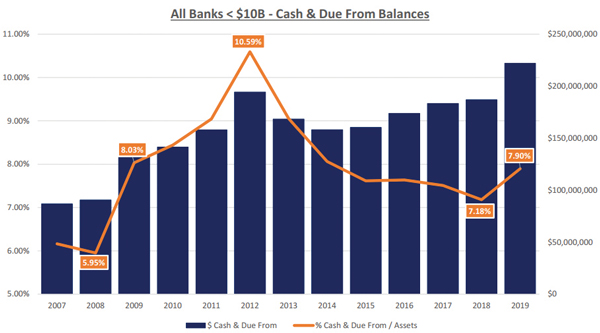
Cash and due from balances as a percentage of total assets reached 7.90% as of year-end 2019. As the chart above illustrates, that level of liquidity was already at or above the average level since 2007. The jump from 7.18% to 7.90%, which occurred 2018 to 2019, very closely mimics the pop in liquidity experienced from 2008 to 2009 (the beginning of the Great Recession). However, it is the three years after 2009 that we are most focused on. Liquidity continued to grow (hitting 10.59% in 2012) as the industry slowly recovered from weakened loan demand and increased deposits from an embattled customer base. The zero-bound range on overnights at the time led to significant drops in overall interest income. As we hit the midpoint of 2020, it appears that the industry must once again prepare to navigate similar waters.
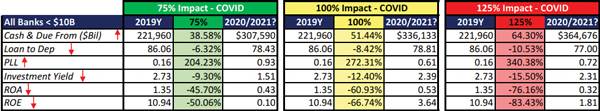
Although we still do not fully understand COVID-19 or the longer-term impact it will have on our economy, we are not completely powerless when it comes to making better-informed decisions. In fact, our performance and trends from past times of crisis can actually become quite useful in a time like this. As we stated earlier, the Great Recession had several important impacts on the overall banking industry. The severe drop in interest rates, mixed with spiking unemployment (sound familiar?), applied extreme pressures on every balance sheet. As we can see below, Loan to Deposit ratios, Investment Yield, and ROA all fell while Provision for Credit Losses and Cash increased leading to lower Return on Equity. Although there isn’t a lot we can do about credit issues or lack of demand on the loan side of things, we can do a better job of managing liquidity and specifically cash this time around.
Andrew Okolski is a Senior Financial Strategist at The Baker Group. He works directly with clients in a broad range of areas, including ALM, education, portfolio management, interest rate risk management, strategic planning, regulatory issues and wholesale market strategies for financial institutions. Before joining the firm, he spent 15 years building and managing a financial strategies group at a New York broker/dealer. Andy holds a Bachelor of Business Administration Degree from Long Island University — C.W. Post. Contact: 800-937-2257, andyo@GoBaker.com.